MM Curator summary
KFF is unable to tell if the economy impact of COVID or the moratorium on eligibility terminations is driving the Medicaid enrollment increases.
The article below has been highlighted and summarized by our research team. It is provided here for member convenience as part of our Curator service.
This data note discusses changes in the number of applications for Medicaid/CHIP coverage during the coronavirus pandemic. Application data include new applications for coverage that are received by state Medicaid/CHIP agencies and (if relevant) the State Based Marketplace; in many states, applications also include renewals and redeterminations. Data are from the Centers for Medicare and Medicaid Service (CMS) Performance Indicator Project, which is designed to track enrollment and an array of other measures to assess states’ Medicaid program performance. However, CMS has mostly focused on monthly enrollment totals, and other measures are either not publicly available or are not included in monthly summaries from CMS, though CMS recently highlighted changes in applications (see Methods box for more details about the data).
Enrollment in Medicaid/CHIP has increased steadily by more than 6 million individuals (9%) from February to September 2020, though it’s difficult to tease out the effects of the economic crisis with people losing their jobs from the requirement that states maintain coverage for people already enrolled in Medicaid during the public health emergency (PHE). The total number of Medicaid/CHIP applications has decreased by more than 150,000 (-6%) in the same time period, which might on the surface suggest that fewer people are applying for coverage even in the face of large job and income losses, but data limitations – in particular, the fact that application statistics do not distinguish between new signups and renewals – make it difficult to draw any clear conclusions.
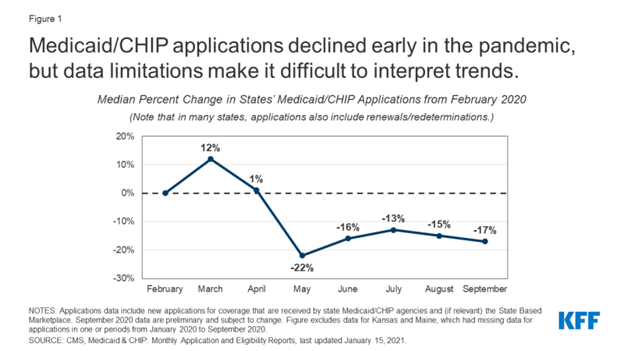
For the median state, which is more stable than using the national total, the number of applications peaked in March 2020 (+12% from February) with a sharp decline in May 2020 (-22% from February), and applications only began increasing again in June and July 2020 (-16% and -13% from February) before leveling off in recent months (Figure 1). The decrease in applications is likely due to a number of factors and likely includes a reduction in renewals and redeterminations as well as the effects of lockdowns and closures due to the pandemic.
Figure 1: Medicaid/CHIP applications declined early in the pandemic, but data limitations make it difficult to interpret trends.
While the continuous coverage provisions of the FFCRA likely played a role in the decline of applications, it is difficult to parse out the impact based on the data available. In exchange for receiving an enhanced federal match rate on Medicaid spending, state Medicaid agencies must ensure continuous coverage for those enrolled as of March 2020. Initial guidance from CMS also specified that states could not move enrollees to a new eligibility category. As a result, most states likely stopped or slowed processing renewals. While states still could not disenroll people from Medicaid, some states may have started to process renewals over the summer contributing to an uptick in applications. States could start a new 12-month renewal period if all other eligibility criteria can be verified. These renewals could help stagger renewals at the end of the PHE. Available data do not identify new applications from renewals or redeterminations, and it is difficult to identify their role in declining application totals. In more recent guidance effective November 2, 2020, CMS reversed earlier guidance and specified that states are required to transition most enrollees determined ineligible for their current coverage to different coverage pathways for which they are eligible if such a transition is in the same tier of coverage (but cannot disenroll individuals). It is possible that this revised guidance could contribute to increases in application data in the upcoming months.
The declines in applications could also reflect challenges related to social distancing measures and office closures during the pandemic. Although all states provide online application options, the median state reported that 55% of Medicaid/CHIP applications completed online, suggesting that a large share of applicants rely on telephone, mail, or in-person applications. Office closures due to the pandemic could have limited some peoples’ options for filing Medicaid/CHIP applications, especially if they have limited access to the internet. It is also possible that prolonged changes in the economy and adaptations to provide better assistance and process new applications may have contributed to the increase in applications after the sharp decline in May. Timely information on the mode of applications is not currently available in national data sets, although it could help identify whether there have been changes in the modes that people apply for Medicaid/CHIP.
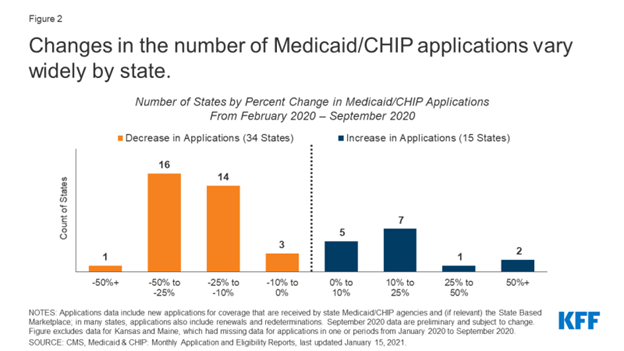
There is wide variation in application trends across states, with the majority of states seeing a decline from February 2020 (Figure 3). Variation in the number of applications is likely related to state-specific policies, economic conditions within states, and even seasonal patterns, such as open enrollment for federal and state-based health insurance marketplaces. Nebraska, for example, has seen a large increase in applications (67%) from February to September 2020, which the state attributed to early applications for the new Medicaid expansion program that began coverage in October 2020, according to a recent CMS Medicaid and CHIP Enrollment Trend Snapshot. Kentucky saw even larger growth, with a 224% increase in applications from February to September 2020, although the reason behind this increase is unclear. The majority of states (34 out of 49 with complete data) reported a decline in the number of Medicaid/CHIP applications since February 2020, with the lowest state (DC) seeing a 55% decline in applications in this time period (Figure 2).
Figure 2: Changes in the number of Medicaid/CHIP applications vary widely by state.
|
Methods |
|
This analysis is based on KFF analysis of the Centers for Medicare and Medicaid Services (CMS) Performance Indicator Project Data. This data set is designed to track enrollment and an array of other measures to assess states’ Medicaid program performance. State Medicaid agencies submit data to CMS each month, and the data are typically used to track current enrollment in Medicaid and CHIP, usually with a 3- to 4-month lag when the data are made publicly available. Other measures aside from enrollment are either not made publicly available or not typically highlighted in monthly summaries, although CMS recently highlighted changes in states’ monthly Medicaid/CHIP applications. Application data reflect all applications received by the state Medicaid and CHIP agency (or agencies) as well as the number of applications requesting financial assistance that have been received by the state-based marketplace (including Medicaid/CHIP applications, Advanced Premium Tax Credits, and Cost Sharing Reductions). Applications that are started on the federally facilitated marketplace are not included in the data. Additionally, 12 states use footnotes in the data between January 2020 and September 2020 to indicate that application counts include renewals and/or redeterminations (AK, DC, IA, MD, MO, NV, NY, OH, OK, PA, VT, VA), although inclusion of renewals/redeterminations or the number of renewals/redeterminations are not standardized measures in the publicly available data. For this analysis, we excluded two states (Kansas and Maine) that have missing data for one or more months between January 2020 and September 2020. |


